Create a Lightcurve
This notebook shows how to create a light curve, either for a single object or a series of objects. First, import the get_all_lcs function from the slsne package.
from slsne.lcurve import get_all_lcs
Use this function to get the individual light curves of SLSNe, as well as the mean evolution in a specific band. By default names is set to None, which will import all the light curves of all SLSNe and return the mean and \(\pm 1 \sigma\) range in AB magnitudes. Values for sigma equal to 1, 2, or 3 can be specified. Alternatively, names can be set to a specific name or names.
# Get light curves of all SLSNe in r-band
band = 'r'
(low, mean, high), (time_samples, lightcurves) = get_all_lcs(band, return_individual=True, sigma=1)

# Get a single light curve
time_samples, r_2018lfe = get_all_lcs(band, names = '2018lfe')
Now we can plot the results. Note the plot_colors function which selects the default color for each band in the database.
import matplotlib.pyplot as plt
from slsne.utils import plot_colors
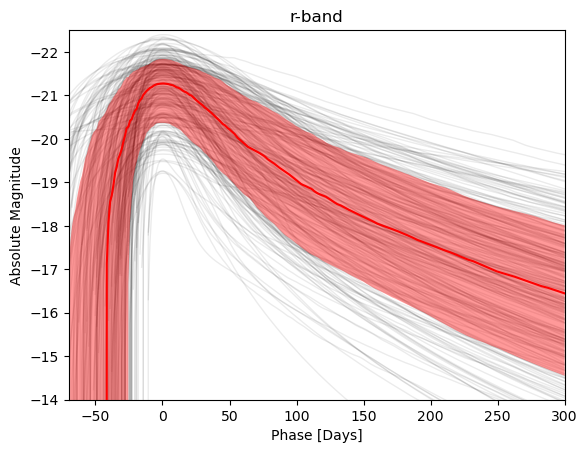
# Plot shaded lines for all individual light curves.
plt.plot(time_samples, lightcurves.T, color='k', alpha=0.08, linewidth=1, zorder = 1)
# Plot the mean range in r-band
plt.fill_between(time_samples, low, high, color = plot_colors(band), alpha = 0.4, linewidth = 0, zorder = 2)
plt.plot(time_samples, mean, color = plot_colors(band), zorder = 3)
plt.title(f'{band}-band')
plt.ylabel(f'Absolute Magnitude')
plt.xlabel('Phase [Days]')
plt.ylim(-14, -22.5)
plt.xlim(-70, 300)
plt.show();